


ost performance review cycles end with a number — a score, a rating, a percentile — and then nothing changes. Managers file their forms, HR pulls a report, and the same talent skill gaps show up again six months later. We've watched this happen across enough L&D training programmes to know the problem isn't the process. It's that companies track the wrong things, or track the right things without connecting them to action.
Tracking and measuring employee training performance only works if what you measure is specific enough to act on. These 10 metrics to measure employee performance are the ones we'd actually use — the ones that tell you something useful, not just something you can put in a dashboard.
Why Standard Performance Reviews Often Miss the Point
The annual or quarterly review is still the dominant format in most companies. You rate someone on a 1–5 scale across a few dimensions, add some comments, and call it done. The problem is that this approach is retrospective and categorical. It tells you how someone performed against a vague standard, not why — and it tells you weeks or months after the moment when something could have been done about it.
Employee performance management metrics work better when they're continuous, tied to specific behaviours or outcomes, and linked to what the person was trained to do. That last part matters more than most HR teams acknowledge. If an employee underperforms on a task they were never properly trained for, that's not a performance problem, it's a training gap. Conflating the two is one of the more expensive mistakes in L&D.
10 Useful Metrics for Evaluating Employee Performance
1. Goal completion rate
The simplest and most direct measure: did the employee complete what they set out to do? Track the percentage of agreed goals met within a given timeframe. Don't average across long periods — look at it quarter by quarter so you can spot trends rather than flukes.
What makes this metric useful is how it holds up when you compare it against difficulty. Someone completing 60% of genuinely stretch targets is performing differently from someone completing 60% of routine ones. Always add context.
2. Quality of work output
This one requires a rubric, which is why many teams skip it. But "quality" is measurable if you define it ahead of time — accuracy rates, error frequency, the number of revisions a deliverable needs, client or peer feedback scores. The metric only works if the quality standard is set before you evaluate, not after.
I'd recommend building quality benchmarks directly into your onboarding training and upskilling programmes. If employees know from day one what "good" looks like, you're not just measuring performance — you're setting expectations they can actually meet.
3. Productivity and output volume
How much is getting done per time period, adjusted for role complexity? This isn't about counting keystrokes. For a sales rep it might be calls handled per day; for a developer, features shipped per sprint; for a support team, tickets resolved without escalation.
Output volume loses meaning without a quality layer. The two should always be read together — high volume at low quality is its own kind of performance problem.
4. Training completion rate
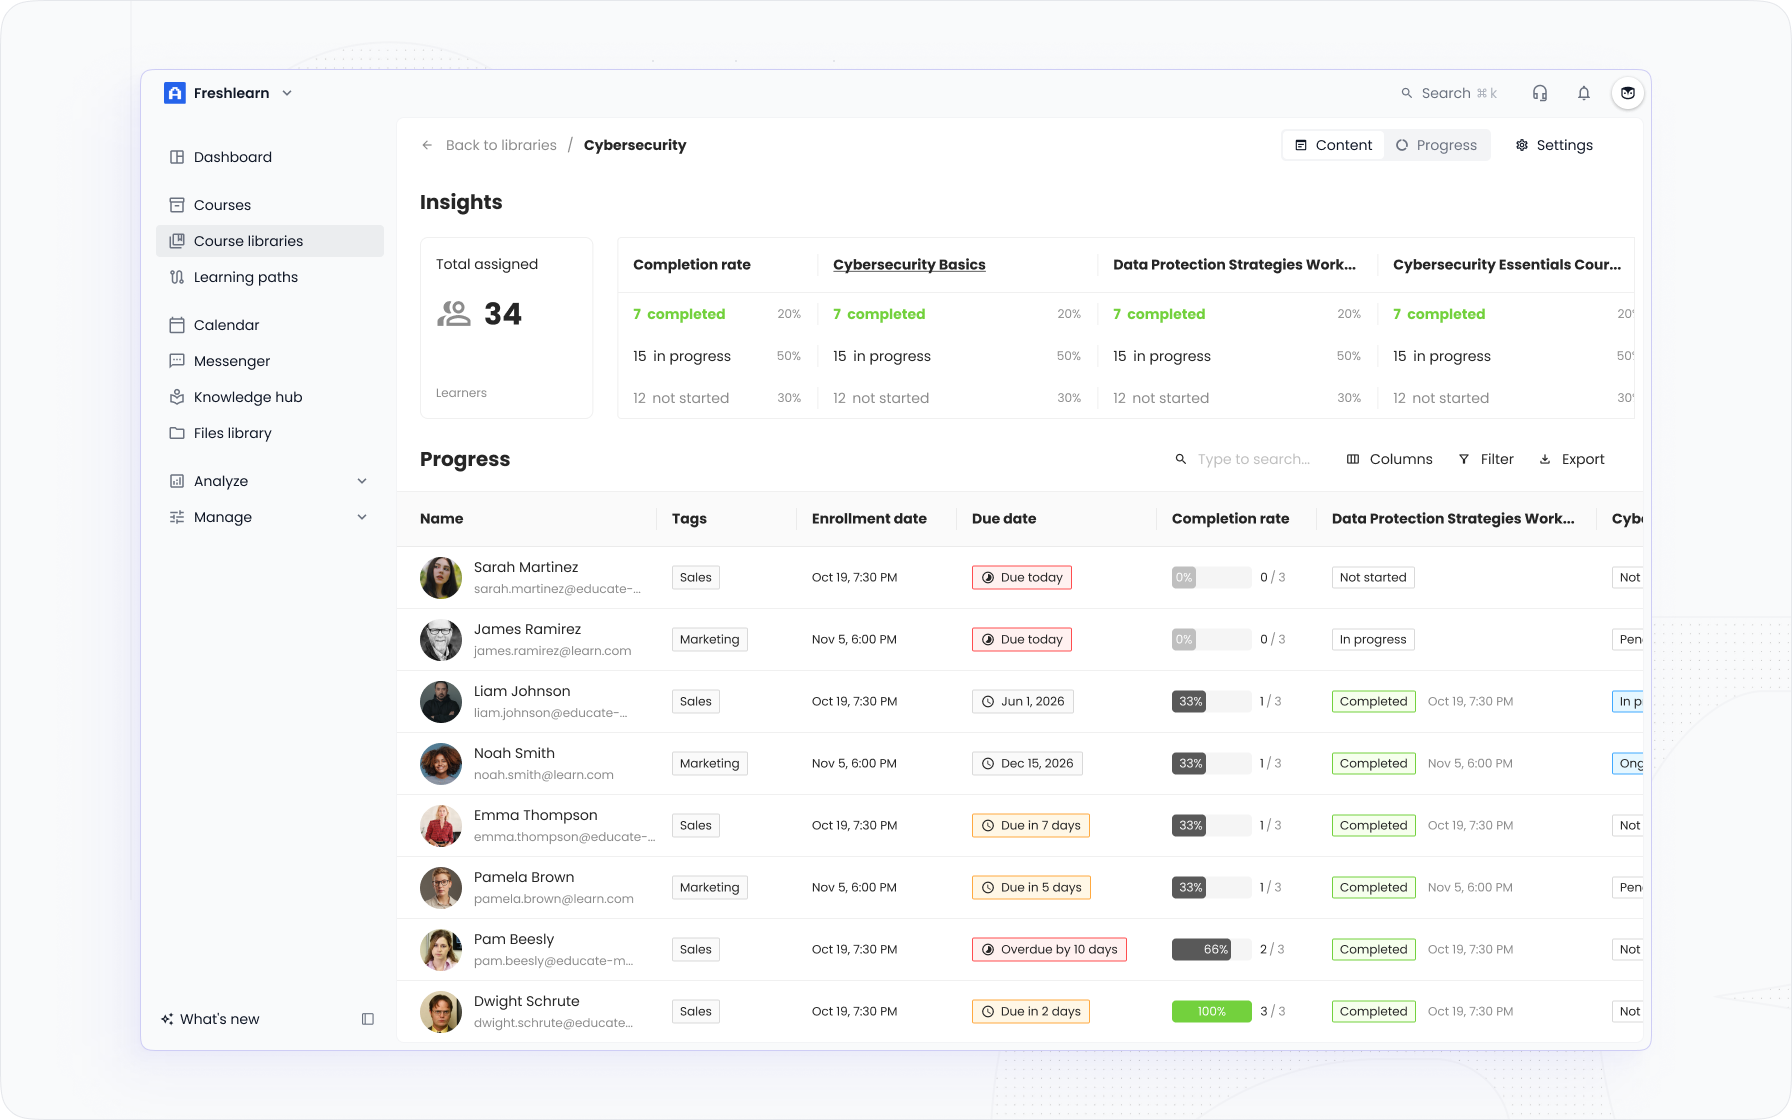
If you run structured training programmes, completion rate is the entry-level metric for gauging engagement and follow-through. It doesn't tell you whether someone learned anything, but it tells you whether they showed up. For compliance training, it's also an audit requirement.
In EducateMe learning analytics, completion data is tracked per learner across every course and learning path — managers get a live view rather than waiting for end-of-cycle exports. That real-time visibility is what makes the metric actually useful. You catch the gaps while there's still time to address them.
5. Assessment and quiz scores
Post-training assessments is one of employee performance metrics that tell you what stuck. They're imperfect — someone can score well on a quiz and still struggle with application — but as a directional signal, they're one of the more honest data points you have.
The pattern I watch for isn't the average score. It's variance. If 80% of a team passes a module and 20% fail it consistently, that's either a selection problem or a training delivery problem. Either way, it's worth investigating before you move on.
6. Time to proficiency
How long does it take a new hire (or a recently reskilled employee) to reach independent performance on a task? This is one of the most undertracked metrics for employee performance in L&D, despite being directly tied to onboarding ROI.
Define "proficient" concretely — not "able to complete the task" but "able to complete it within X minutes with fewer than Y errors" — and measure from hire date or training start to that threshold. EducateMe customers using AI-assisted onboarding paths report reaching that threshold 1.8x faster than with traditional approaches, according to platform data. The metric only validates if you've defined the endpoint clearly.
7. 360-degree feedback scores
Structured peer and manager feedback — collected systematically, not informally — surfaces behaviours that output metrics can't. How well does someone communicate across teams? Do they contribute to others' work? Are they reliable when things get difficult?
According to Gallup's State of the Global Workplace 2025 report, global employee engagement fell to 21% in 2024, costing the global economy $438 billion in lost productivity. A lot of that disengagement shows up in behaviours long before it shows up in output numbers. Regular 360 feedback is one of the few ways to catch it early.
8. Employee engagement and satisfaction scores
Pulse surveys and structured engagement tools give you a read on how employees feel about their work, their team, and the organisation. Low engagement doesn't automatically mean poor performance — but it's a reliable leading indicator that performance problems are coming.
Measure this quarterly at minimum. Annual surveys are too slow to be actionable. And don't just track the aggregate — segment by team, tenure, and role. The pattern inside the average is usually more informative than the average itself.
9. Absenteeism and tardiness rate
Unplanned absences and chronic lateness are employee performance evaluation metrics in a different guise. They correlate with disengagement, team friction, and sometimes personal circumstances that need support rather than disciplinary response.
Track them per employee over a rolling 90-day window rather than as a single annual figure. Spikes matter more than baselines, and spikes in absence often precede other performance issues by several weeks.
10. Internal mobility and promotion rate
How often are employees moving into new roles, taking on expanded responsibilities, or being promoted? For L&D specifically, this is the metric that connects training investment to actual career progression. If your upskilling programmes are working, you should see it in the internal mobility numbers.
If you're running structured employee upskilling programmes and your internal mobility rate is flat, something in the training-to-application chain is broken. That's worth tracing before spending more on content.
How to Turn Employee Performance Metrics Into Action
Tracking these ten employee performance measurement metrics is the easy part. The harder part is using them in a way that connects performance data to L&D decisions.
Here's the approach I'd recommend: run a quarterly review across goal completion, training scores, and time-to-proficiency for each team. Where you see underperformance clustering in the same area — say, a specific skill set or a department that's consistently behind on quality scores — you're looking at a training gap, not just a performance gap. That distinction changes what you do next.
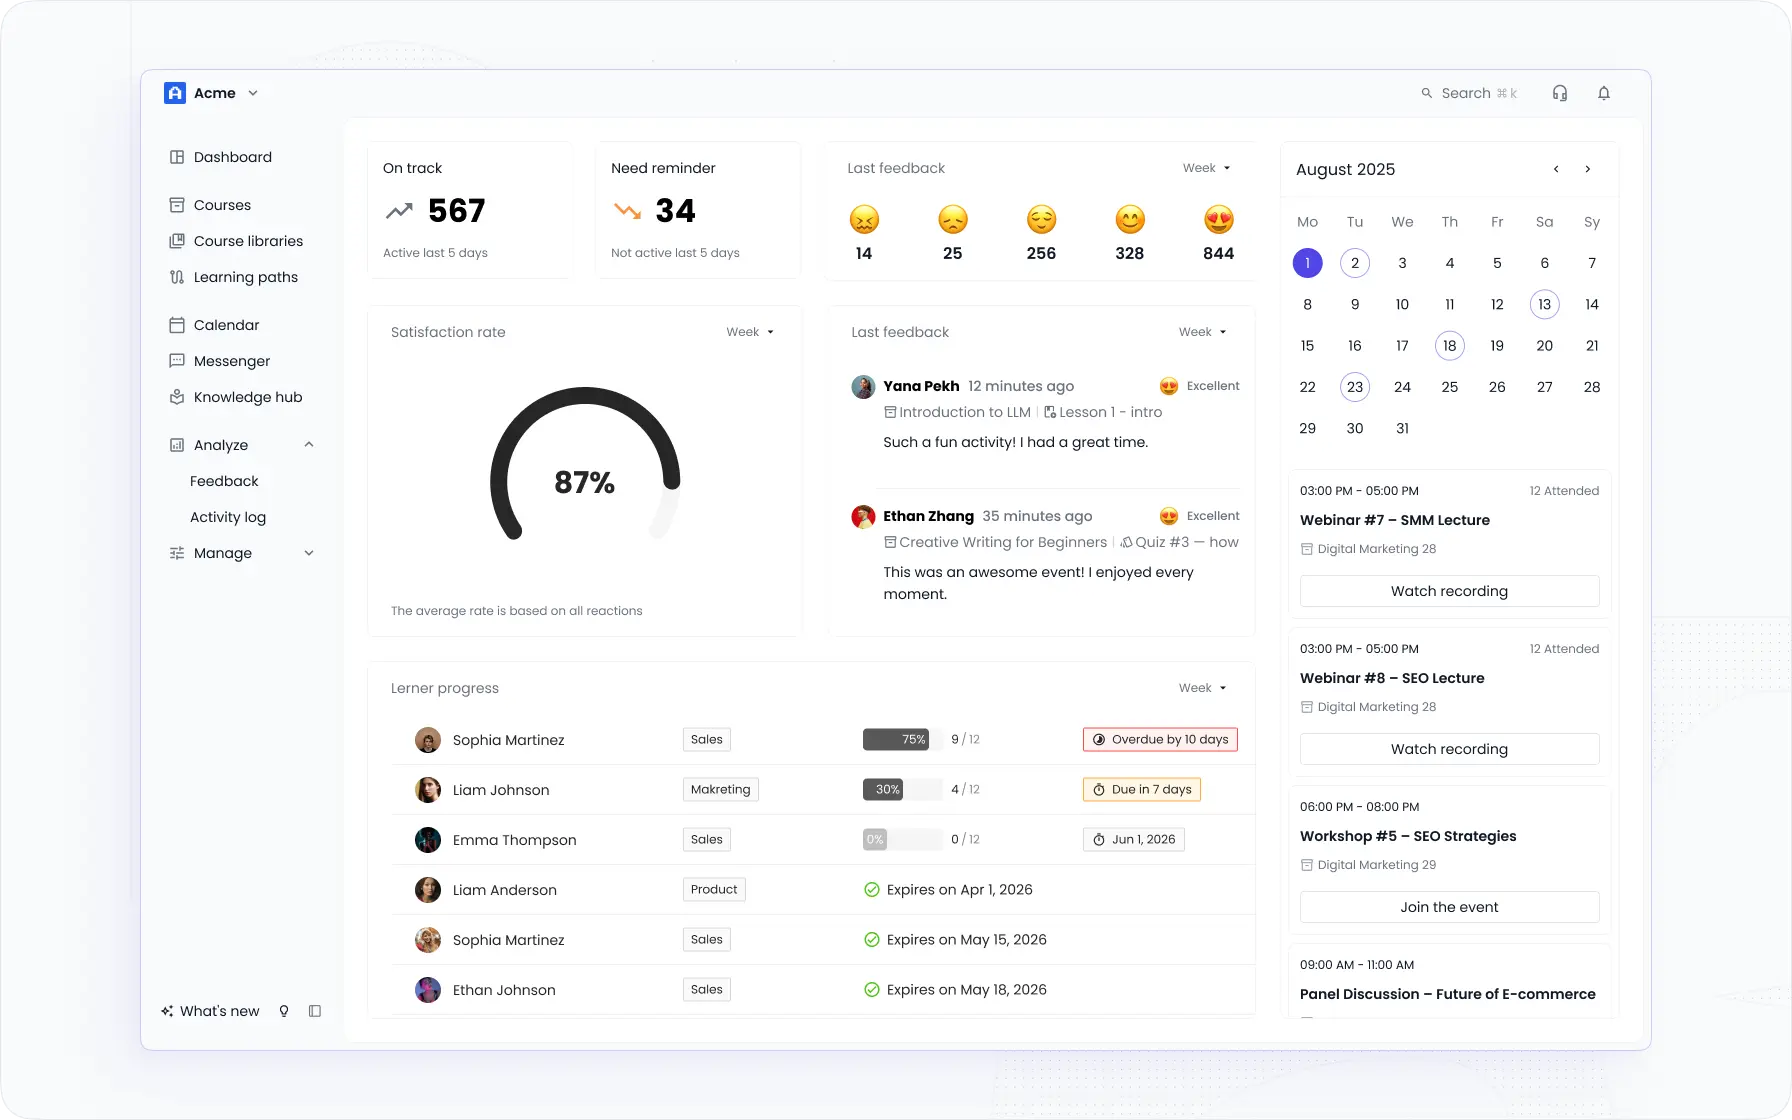
Platforms like EducateMe surface this kind of pattern through their learner analytics dashboard, giving managers visibility into completion rates, quiz scores, and skill gaps without having to pull data manually. That's the difference between a metric being informative and it being actionable.
What I've found consistently is that the benefits of structured employee training don't show up in satisfaction scores alone — they show up in exactly the metrics above. Faster proficiency, higher completion, measurable output improvement. Those are the signals worth tracking.
The types of employee training programmes you run should map directly to the metrics you care about. If you want to improve quality scores, you train for quality standards. If you want to cut time to proficiency, you redesign onboarding. The connection has to be explicit, or you're just adding training content without knowing if it does anything.
Frequently asked questions
What metrics measure employee performance most accurately?


There's no single metric that captures performance on its own. Goal completion rate and quality of output are the most direct measures, but they need to be read alongside engagement scores and time-to-proficiency to give you a complete picture. The most accurate performance assessment combines quantitative output data with structured feedback from peers and managers.
How often should employee performance metrics be reviewed?
Quarterly is the minimum for most metrics — annual reviews are too infrequent to catch problems before they compound. Engagement and pulse scores benefit from monthly tracking. Training completion and assessment data should be monitored in near-real-time, especially during onboarding. Platforms like EducateMe make this practical by giving managers live dashboards rather than static end-of-cycle reports.
What's the difference between employee performance metrics and KPIs?
KPIs (Key Performance Indicators) are the specific, quantified targets a role is measured against — "close 15 deals per month" or "resolve 95% of tickets within 24 hours." Performance metrics are broader and include behavioural and developmental measures like training completion, 360 feedback scores, or engagement levels. KPIs sit inside a larger performance measurement framework, not outside it.
Can training data be used to predict performance issues?
It can, and I'd argue it should be. Employees who fall behind on training completion, score below threshold on assessments, or disengage from learning paths often show performance dips 4–6 weeks later. Tracking learning data alongside output metrics gives L&D teams a leading indicator rather than a lagging one — which means there's still time to intervene.
